feigenbaum
the boundary between order and chaos is a constant.
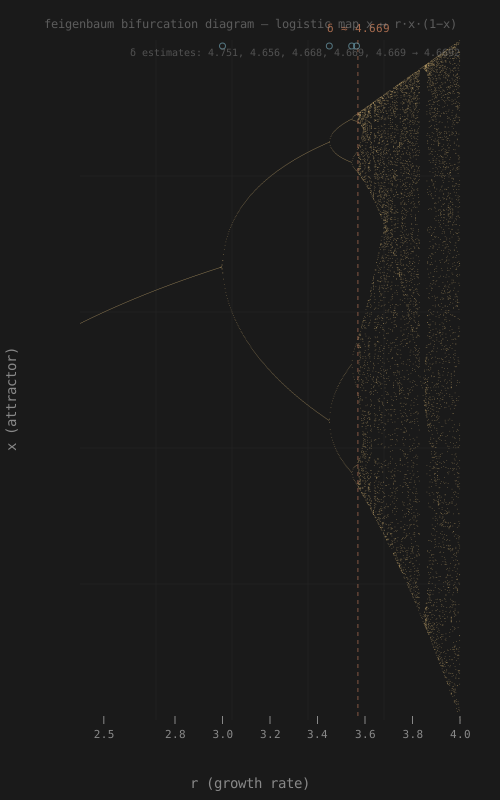
what it shows
the logistic map: x → r·x·(1−x). iterate it. as the
growth rate r rises from 2.4 to 4.0, the long-term behavior
bifurcates — first a single fixed point, then period 2, then 4, 8,
16, 32… and then chaos.
the ratio of successive bifurcation gaps converges to Feigenbaum's δ ≈ 4.669. and δ is universal: it holds for every one-hump map that period-doubles into chaos, not just the logistic. the constant isn't about this equation — it's about the geometry of function space itself.
how the convergence works
each bifurcation happens at a specific r value. the gaps between them shrink geometrically:
r₁ = 3.0            (period 1 → 2)
r₂ = 3.4494897...   (period 2 → 4)
r₃ = 3.5440903...   (period 4 → 8)
r₄ = 3.5644072...   (period 8 → 16)
r₅ = 3.5687594...   (period 16 → 32)

δ₁ = (r₂ − r₁) / (r₃ − r₂) = 4.751
δ₂ = (r₃ − r₂) / (r₄ − r₃) = 4.656
δ₃ = (r₄ − r₃) / (r₅ − r₄) = 4.668
δ₄ = (r₅ − r₄) / (r₆ − r₅) = 4.669
by the sixth bifurcation, the estimate already agrees with the true δ to four decimal places. the cascade accelerates toward r∞ ≈ 3.5699 — the Feigenbaum point — where the period becomes infinite and chaos begins.
why it matters
a universal constant means the period-doubling route to chaos isn't a property of any single system — it's a property of the space of all one-dimensional unimodal maps. the period-doubling operator has a fixed point in function space, and δ is one of its eigenvalues.
the boundary between order and chaos was never a boundary — it was our instrumentation. the category dissolves and what's left is the mechanism: the constant is the map.
where the name comes from
Mitchell Feigenbaum discovered the constant in 1975 using an HP-65 programmable calculator. he didn't prove it — he noticed the numbers converging. the proof came later, from universality in renormalization group theory. the constant that governs the onset of chaos was found by someone who looked at numbers long enough to see the shape.
source
builds/feigenbaum/feigenbaum.py — generates the SVG.
run with --delta to see the convergence estimate,
--r-min/--r-max to zoom,
--light for a light background.